Wardley Maps—an Illustration from Gerstner’s book
I’ll be mapping a few important chapters of Lou Gerstner’s book, Who Says Elephants can’t Dance (amazon affiliate link)1, as illustrating Wardley Mappings. Not that Gerstner draws maps for us but his descriptions and narratives embody much strategic thinking that I couldn’t help recall Wardley’s Strategy Cycle, which led to an attempt at visualising them using Wardley Maps.
Justifying my application
But, before we explore the maps from Gerstner’s book, I’d like to explain why I think it’s the best that I’ve come across that illustrates Wardley Mapping, looping through the Strategy Cycle within a business context.
When I say “the best,” I mean it in the sphere of what I’ve come across and read. This sphere is naturally quite narrow.
Of all the materials out there, a subset have been published or made public. Of these, I’ve read a small portion. Of those that I’ve read, I see two that are relevant to Wardley Maps. I’ve restricted myself to books. Articles are too short for this purpose. On the other hand, I could wade through documents, such as annual reports of publicly traded companies – this I occasionally do – but these make for dull reading, let alone function to impress the mind with vivid illustrations.
First are the series of books by Peter Krass. These consist of a collection of articles from the leading business men and women of the time, articles arranged around varied themes within the broader categories of Business, Management, Leadership, Entrepreneurship, and Investment. I mention these series because, in them are many articles contributed by several contemporaries of Gerstner — such as Bill Gates (Microsoft), Larry Ellison (Oracle), Andy Gove (Intel) — contemporaries that he speaks of.
Secondly, there’s Richard Tedlow’s book, Denial: Why Business Leaders Fail to Look Facts in the Face—and What to Do About It (amazon affiliate link). The Wikipedia entry summarises it as:
The book has two parts. The first portion highlights companies that have struggled to solve matters within their respective businesses while the second part features firms that successfully overcame obstacles.
From my perspective, the scope of what they did and didn’t do is too narrow when compared to Gerstner’s book in the following sense: with Gerstner, he described to us the context (the market, customers, competitors, employees, culture, leadership) followed by his actions whereas in “Denial,” it’s Tedlow (the author) who tells us the context and then explains the actions or inaction of the business leaders at that time. This gives the impression (at least to me), that the companies spoken of didn’t know (or didn’t make explicit) the context (at least the critical parts relevant to them) in which they operated, i.e., didn’t know their landscape. Of those that did, their landscape and corresponding value chains described were small – made up of a few components – in comparison to Gerstner. If you don’t know the landscape, how can you apply doctrine, climatic patterns, and gameplay on an industry/market level ?
Regarding learning to map, the task is two-fold: to find materials ample enough to cover all the elements of Strategy (in business), and on the other hand, to express them on one or several Wardley Maps. Relevant books and articles furnish us with materials. What’s left, for us learners, is to map them. Laying aside how true they are and to what degree, these materials become common ground to those learning. Imagine a book club, with the added twist that the selected book is mapped, and the subsequent discussions revolve around the maps produced.
Gerstner’s book/memoir furnishes me with such materials with a large enough scope – that of a big, mutlinational corporation – and an acknowledge of the role luck plays in succeeding.
Assumed knowledge and how I’ll quote
Before I proceed to the parts of the Strategy Cycle, I hope you’ve already read Gerstner’s book. Otherwise, I might spoil it for you. I’ll take it apart (figuratively speaking) and place chapters/sections where I think they’d fit on the Wardley Map and the Doctrine cheatsheet without much regard to their sequential order in the book. This is a poor man’s version of Boyd’s “analysis” and “synthesis,” which he taught through a mental exercise that ends up with snowmobiles. I’m hoping this ends up as useful regardless of being small in degree.
Secondly, to keep the article as short as possible, I’ll assume that you’re already familiar to some extent with Simon Wardley, Wardley Maps, and the corresponding terms and symbols (see Figure 60 and 61 in Chapter 6)
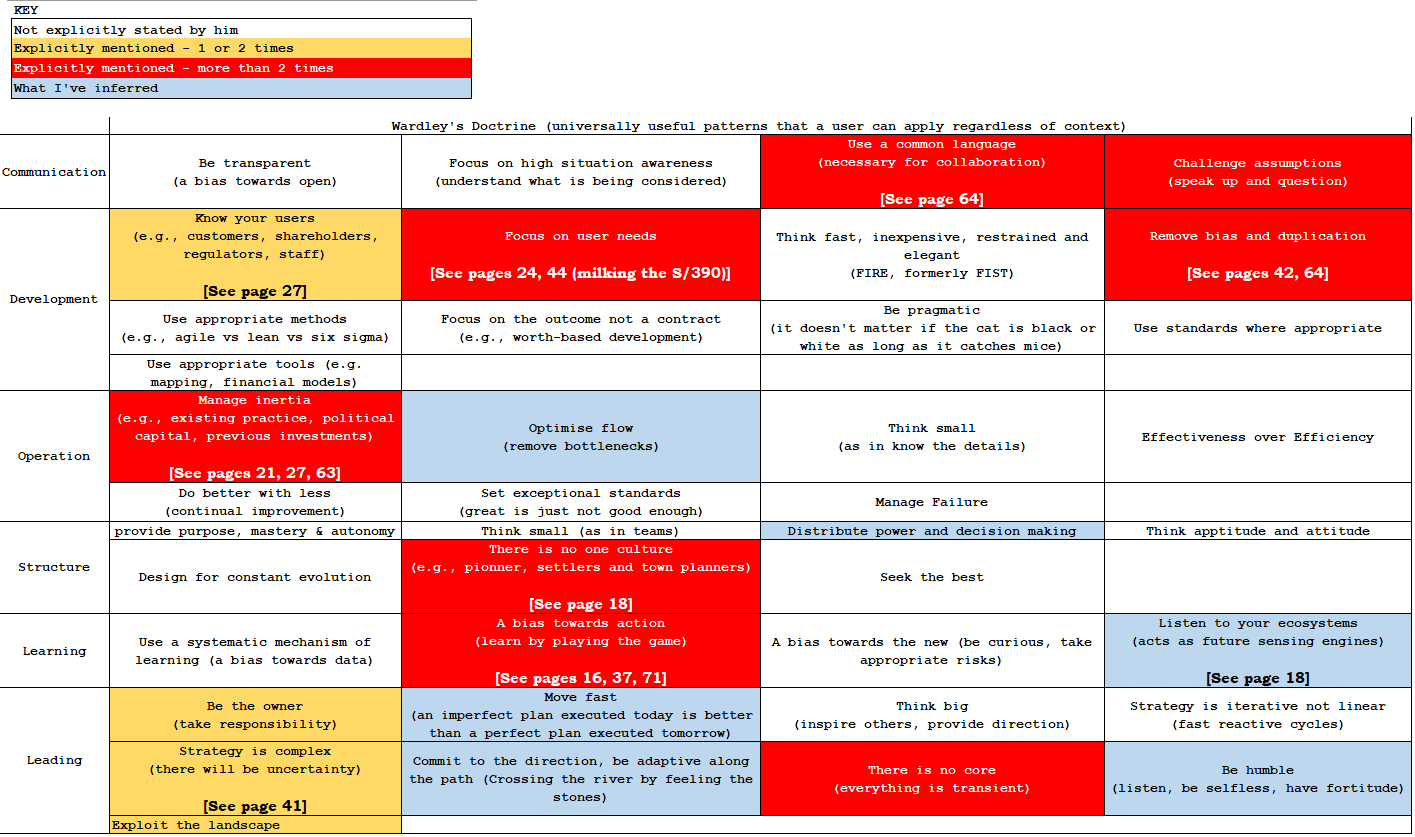
Thirdly, to use Gerstner’s words to illustrate Wardley Maps would require quoting from him extensively. E.g., to illustrate the point of “removing bias and duplication” within the “Development” category of Doctrine, I’d show the current state with the appropriate quote (in RED), followed by the decisions reached and actions taken, and finally how this point looked like afterwards (in ORANGE). Limiting myself to only those descriptions of the current state, he says this about “duplication” on page 42:
I returned home with a healthy appreciation of what I had been warned to expect: powerful geographic fiefdoms with duplicate infrastructure in each country. (Of the 90,000 EMEA employees, 23,000 were in support functions!)
Then again on page 64 (note he uses “division” instead of “geography” – the difference is huge especially in the context of a global company):
Today (circa 2001) IBM has one Chief Information Officer. Back then we had, by actual count, 128 people with CIO in their titles—all of them managing their own local systems architectures and funding home-grown applications. . . The result was the business equivalent of the railroad systems of the nineteenth century—different tracks, different gauges, different specifications for the rolling stock. If we had a financial issue that required the cooperation of several business units to resolve, we had no common way of talking about it because we were maintaining 266 different general ledger systems. At one time our HR systems were so rigid that you actually had to be fired by one division to be employed by another.
There are 15 more page numbers (in different parts of the book) that correspond to the different points of Wardley’s Doctrine to show us the situation at the time (what I’m referring to as the “current state”). And that’s just the first part – the current state. There are many other passages on the decisions and actions he took, and what the corresponding result was. To reproduce all that here would definitely overstep the “fair use” policy of copyright in books. Unless one of you know him and can ask permission form him – after all, it’s for educational purposes 🙂
Therefore, I’ll state the page numbers in the relevant sections, which should help you find your way. As seen above, his descriptions are excellent. I know it’s cumbersome to read an article on the one hand, and on the other, to look up pages in another book. Nevertheless, I’d still recommend it. Who knows, you might find even more that I’ve probably missed. I’ll restrict myself to quoting where it matters to make an impression on the mind.
Looping around the Strategy Cycle
I’m referring to Wardley’s Strategy Cycle below:
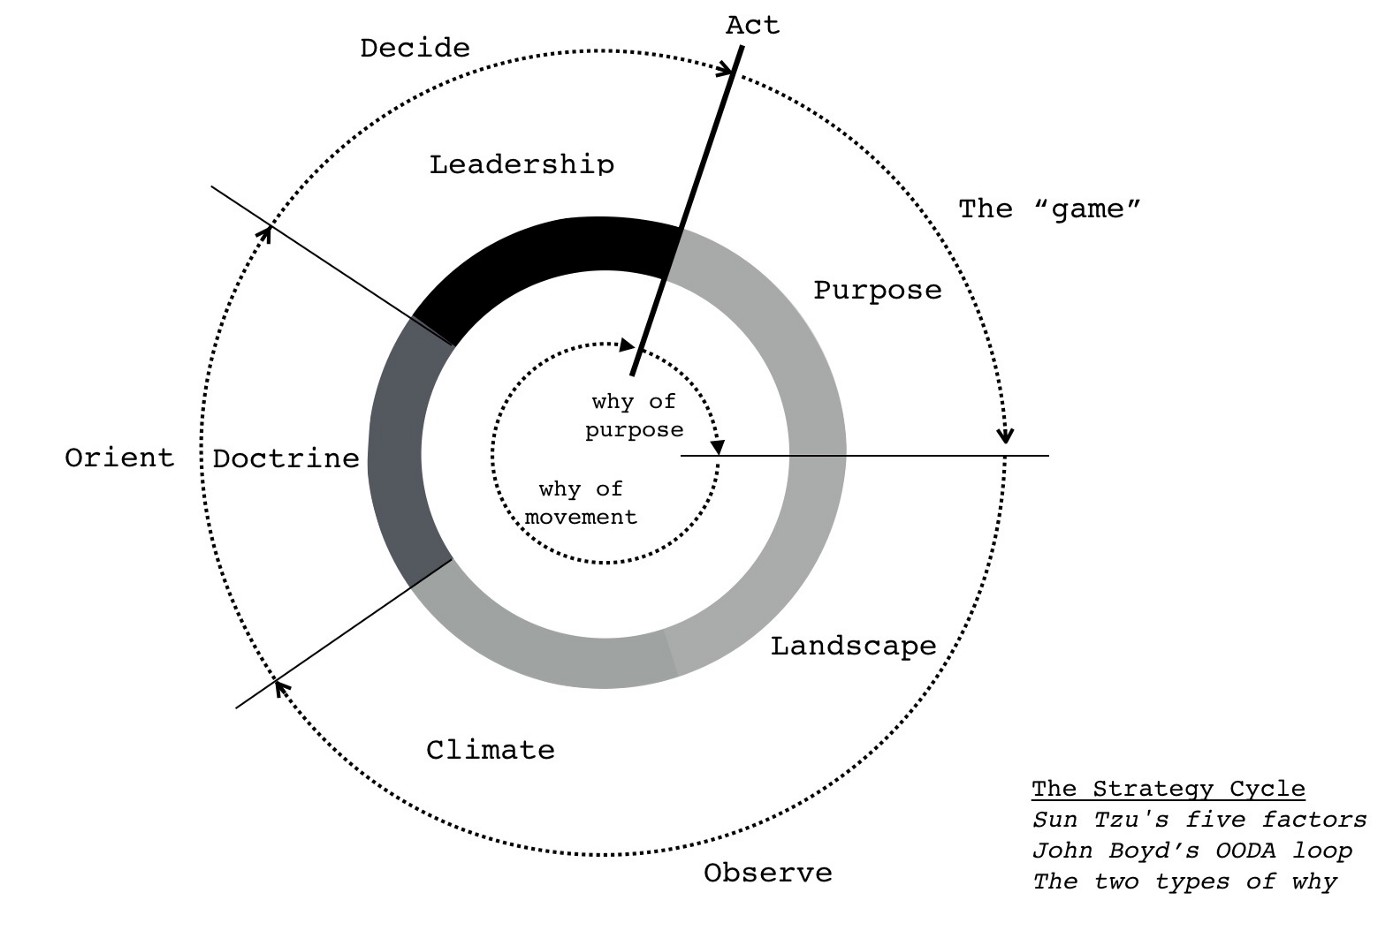 Simon Wardley’s Strategy Cycle
In this book are, what seems to me, several loops around it:
- The first loop consists of chapters 3 to 7.
- The second loop consists of chapters 8 to 10.
- Another is in Part II of the book.
- Yet another is Part III of the book.
Other parts of the book contain more iterations around the Strategy Cycle. For this article, I’ll start with the first loop.
First map and corresponding Doctrine
The map below shows the current state of IBM – recall it’s in the mid-1990s. I’ve kept it simple. I’ve placed the map of Wardley Maps on top of, or next to, what I’d represent as IBM’s map.
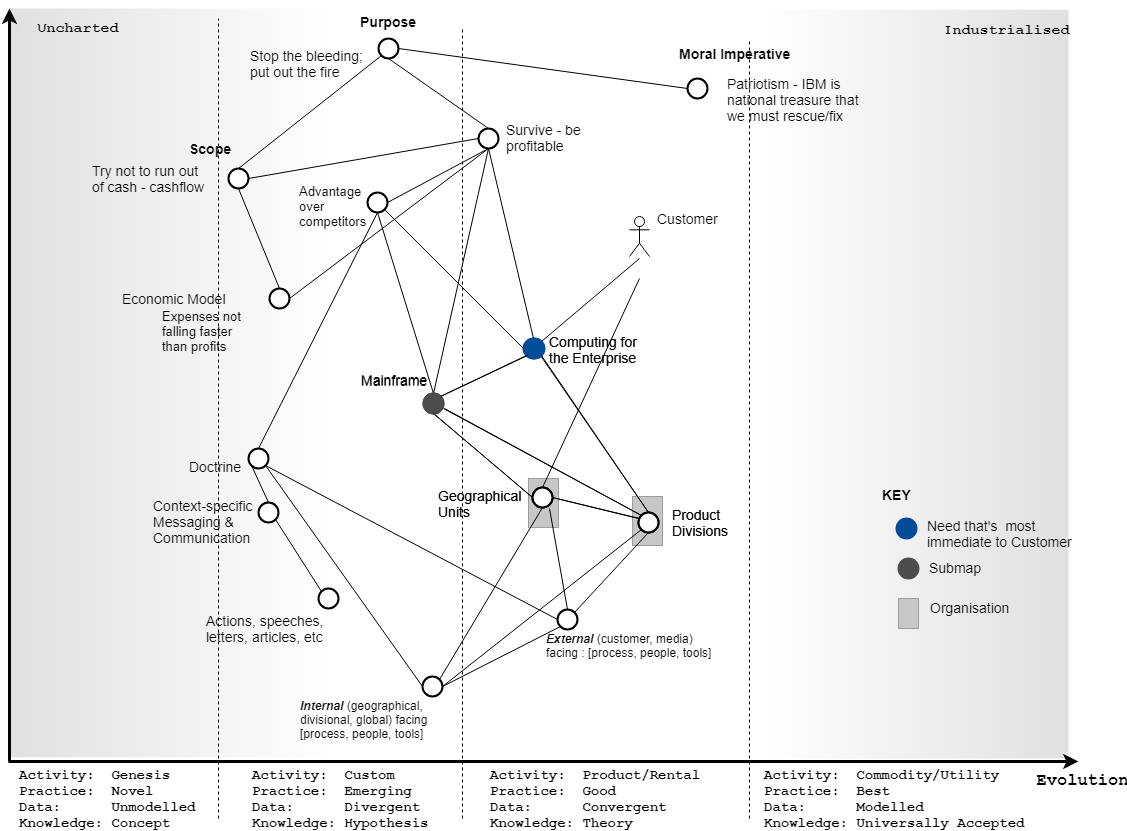 Figure 1 – Map of business landscape
Because of this overlay, Point 1 in Figure 2 below shows what has an effect on Doctrine, that is, the internal and external processes on Doctrine, and the most important of all, the messaging – whether it’s something important to the CEO, senior leadership, and to the company. If restricted to the CEO, this shows itself in the what he says, the decisions he makes, and the actions he takes.
An example of this is when Gerstner, having decided to stop milking the Mainframe, re-invests in it in order to lower its prices – good for the Customer; risky for the company in improving cashflow and remaining profitable.
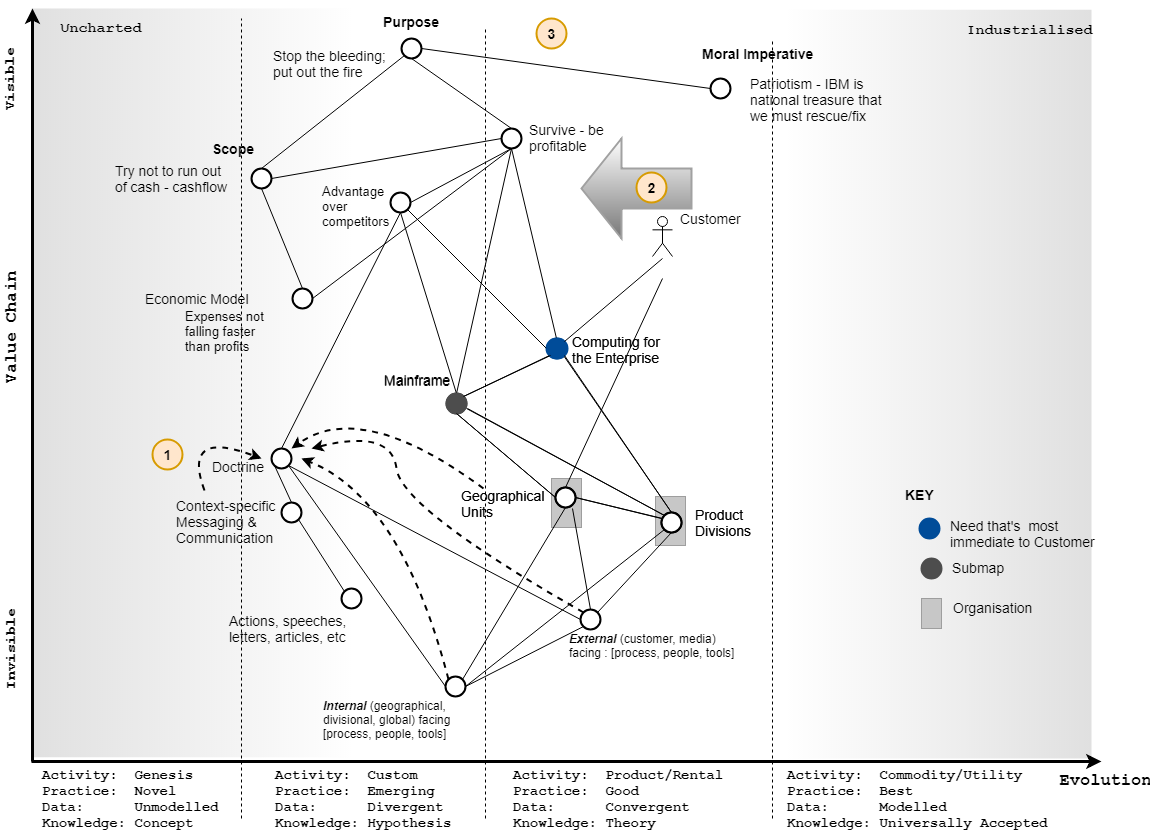 Figure 2 – Influences on Doctrine and historical play
I’ve added the component of “Messaging and Communication” because of Gerstner’s estimation of it during transformational efforts, namely:
The sine qua non of any successful corporate transformation is public acknowledgment of the existence of a crisis. If employees do not believe a crisis exists, they will not make the sacrifices that are necessary to change. Nobody likes change. Whether you are a senior executive or an entry-level employee, change represents uncertainty and, potentially, pain. (p. 77)
The importance of this “Messaging and Communication” component is felt today in other companies. Consider the effect that Jeff Bezos’ letters has had on Doctrine at Amazon. Or the effect from Warren Buffett’s annual letters for Berkshire Hathaway.
Point 2 in Figure 2 above is supposed to show what happened to cause the company to lose market share and money. This made most of the components have the characteristics and properties found in the “Custom” phase.
Point 3 is to show that a lot of uncertainty surrounded the major three components but not “Moral Imperative.” This uncertainty made these components risks. There was no guarantee, as Gerstner explains, that the company would succeed in stopping the bleeding, let alone be profitable. Nevertheless, the “Moral Imperative” was felt keenly and strongly – in the board members, in Gerstner, in the senior leadership team, and in many of the employees.
Doctrine
I’m taking liberties with where I put Doctrine. When I see it in the “Genesis” and “Custom” phases, I interpret it to mean that the Cheatsheet will contain lots of red. As we move through the stages of Evolution, it becomes orange, then green. As I mentioned earlier, I’ve added the page numbers in the relevant boxes, which should help you find your way.
Add Decisions and Actions to the map
The map below shows Gerstner’s decisions and the affected components. This corresponds to the “Decide and Act” part of the Strategy Cycle.
Besides the two decisions that he made early on — keeping the company together instead of splitting it and repositioning the mainframe — Gerstner introduces three initiatives that are shown in the map below.
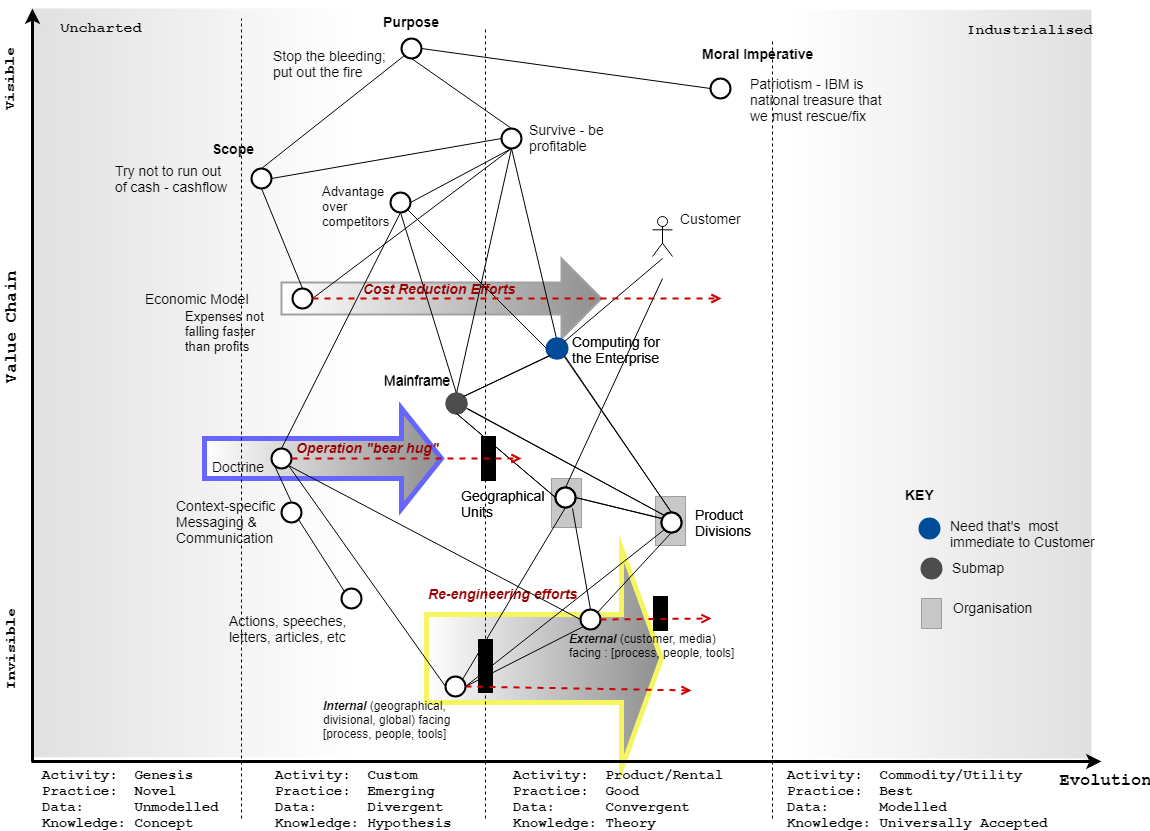 Figure 3 – Initiatives, Inertia, and points of change
Keep in mind that I’ve oversimplified the components “External facing” and “internal facing.” What I quoted at the beginning of this article is one of the things that Gerstner says about them.
He further added, that:
Reengineering is difficult, boring, and painful. One of my senior executives at the time said: “Reengineering is like starting a fire on your head and putting it out with a hammer.” (p.64)
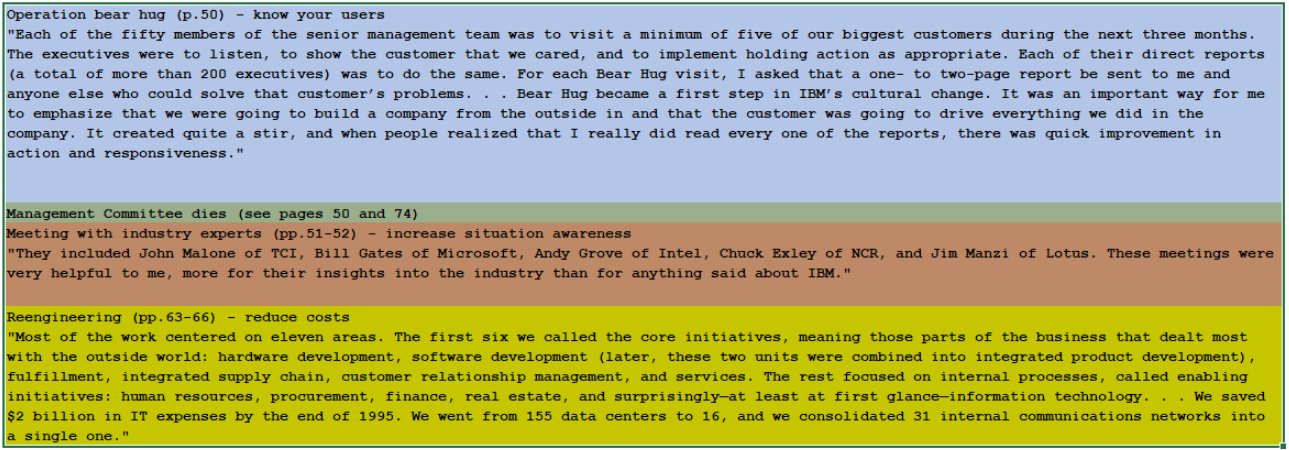 Table 2 – Initiatives Summarised
Areas of Doctrine affected by Initiatives
These initiatives affected these areas of Doctrine. I’ve kept them colour-coded with the parts of the map.
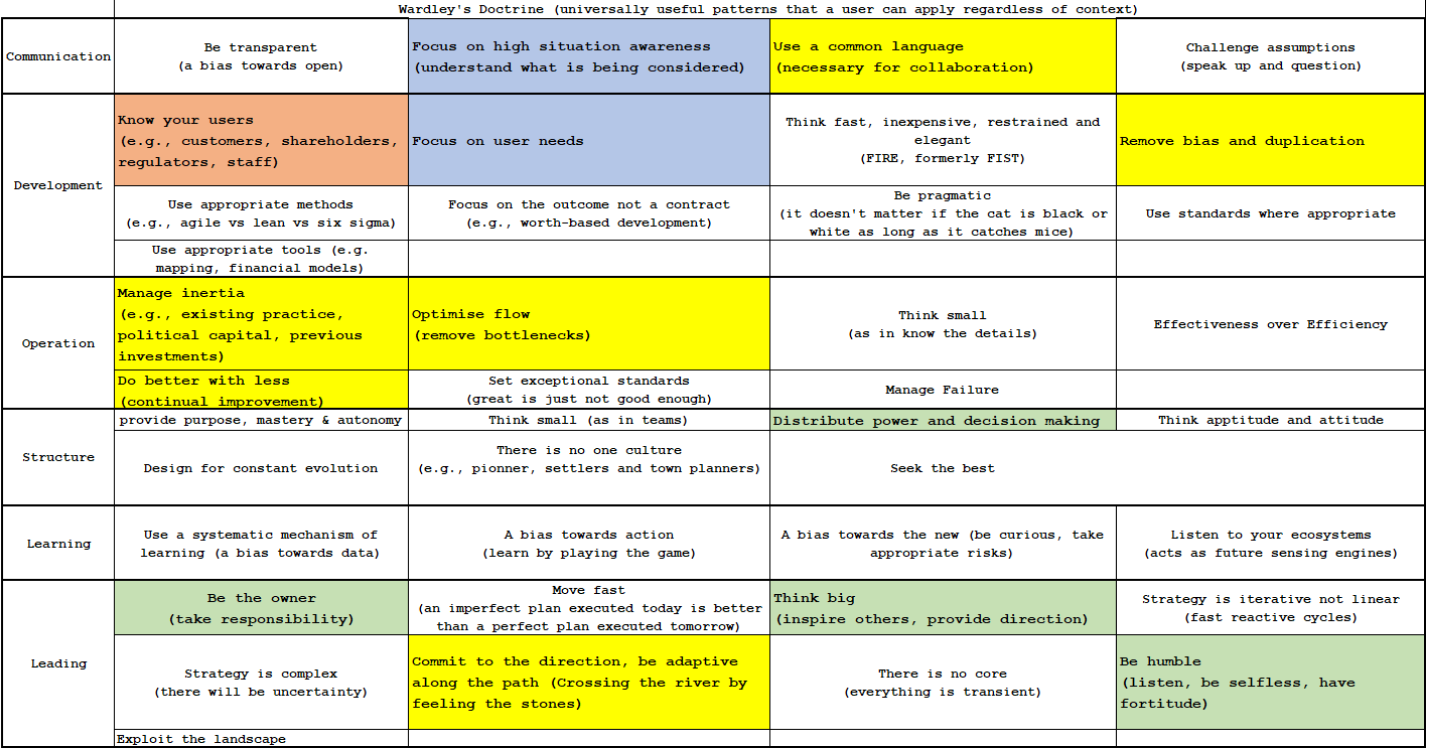 Table 3 – Initiatives affecting Doctrinee
Initiatives change the map
These initiative, running in parallel, took many years to complete. Nevertheless, even after one year, there was much improvement. Gerstner summarises some of them (see pp. 65-66):
By addressing some of the obvious excesses, he had already cut $2.8 billion from our expenses that year alone. Beyond the obvious, however, the overall task was enormous and daunting.
The map below shows how the components have moved. One point to note is that the dotted red arrows start from where a component was before the initiatives started.
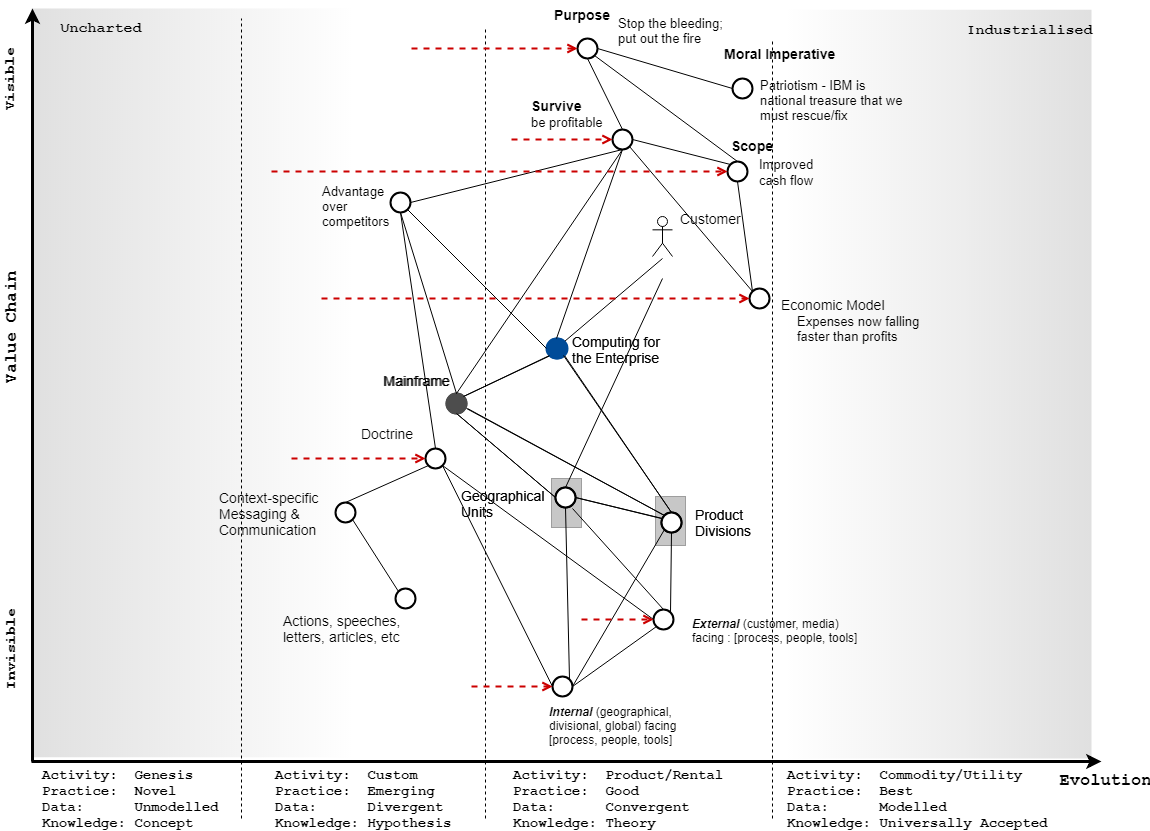 Figure 4 – a changing landscape
He goes on to tell us:
From 1994 to 1998, the total savings from these reengineering projects was $9.5 billion. Since the reengineering work began, we’ve achieved more than $14 billion in overall savings.
Since he doesn’t mention the time period, I’m assuming a time period of approximately 8 years — from 1993 to 2001 — to improve the area of Doctrine of “Optimise Flow” (in category “Operation”)
Hardware development was reduced from four years to an average of sixteen months—and for some products, it’s far faster. We improved on-time product delivery rates from 30 percent in 1995 to 95 percent in 2001; reduced inventory carrying costs by $80 million, write-offs by $600 million, delivery costs by $270 million; and avoided materials costs of close to $15 billion.
Doctrine is also changing
Some areas of Doctrine are no longer “red” but “amber.” They’re not “green” because the Doctrine component is not yet in the Utility phase and there are also more iterations to come around the Strategy Cycle.
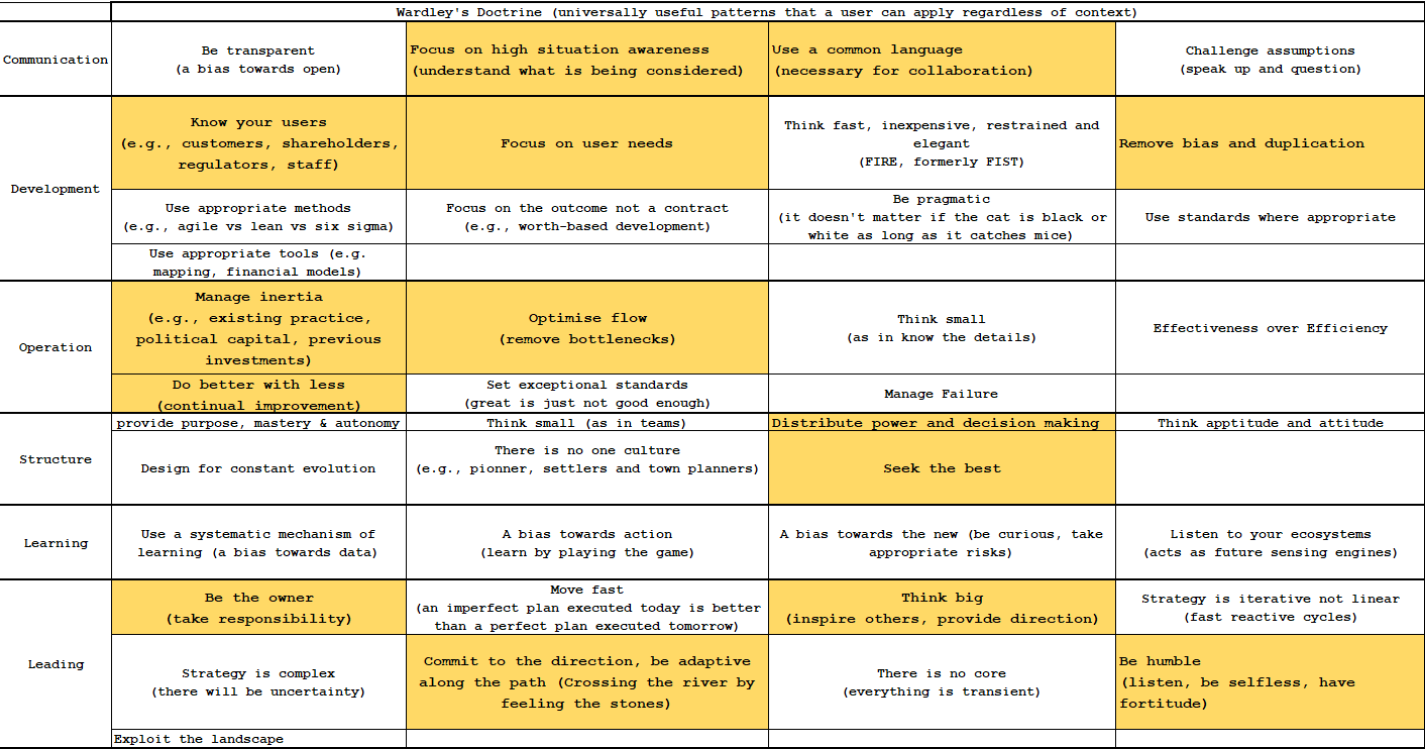 Table 4 – Improved Doctrine through Initiatives
Preparations for the second loop
We’re now in a position to start looping around the Strategy Cycle a second time. Describing it all might be too much for this single article. If you, dear reader, have read thus far, I’ll leave you with the starting point of the next iteration in the map below, where the node “previous Wardley Map” encapsulates the aforementioned maps.
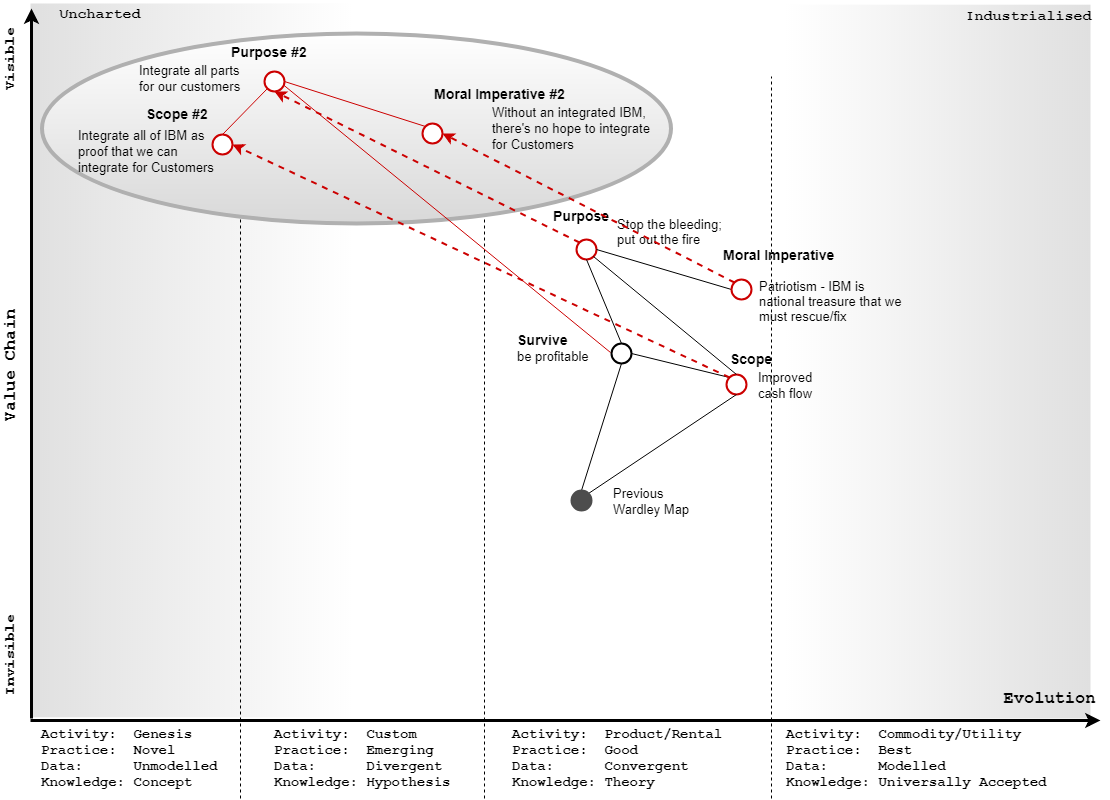 Figure 5 – How starting the second loop would look like
Conclusion
I’ll admit that reading this book several times in order to follow the threads of each point of doctrine, pattern, and gameplay has been weary at times. For the repetitious readings, like the repeated use of sharp knife, often blunts the impact of these impressions on my mind.
On the other hand, by the same repetitious process, I engrave again on my mind those traces that are bound to easily fade.
References and useful links
There’s an online course that teaches2 Wardley Mapping – https://learn.hiredthought.com/p/wardley-mapping.
